What do 3.2 million bikesharing trips look like? Chicago’s Divvy bikeshare system hosted a contest earlier this year to encourage designers, developers and scientists to create visualizations that represent the data from Divvy’s 4,760 bikes and 476 stations over the past year in an insightful, beautiful or creative way.
For a city that is home to the largest service area of any single North American bikesharing system, that’s no small feat. The dataset provided to contestants included geographic information as well as trip dates, trip routes and rider type (either annual member or 24-hour pass user).
Divvy presented awards in seven categories including Most Original, Most Insightful, and Most Comprehensive. While many of the winner’s projects were interesting, a few projects in particular stood out. Following are three of our top takeaways from the Divvy data challenge.
- Annual Divvy members and day-pass users use Divvy in different ways
In a visualization that won Chicago consultant Abinhav Singh the “Most Comprehensive” award, Singh compared usage patterns of annual members and day-pass users using three metrics: trip length, route and frequency. Through his analysis, Singh found that the average member uses Divvy on the weekdays, traveling between stations within the downtown area and riding for 30 minutes or less, which is the maximum amount of time a rider can use a Divvy without incurring extra usage costs.
 In contrast, Singh found the average day-pass user rides mainly on the weekend, travels between bike stations near parks, and takes trips that frequently exceed 30 minutes. This overall pattern suggests that day-pass users are more inclined towards recreational biking, while members use Divvy for commuting. Considering the comparatively high cost of a 24-hour pass, day-pass users seem to consist mainly of tourists and others who are looking for a joy ride or to sightsee around the city. Annual members, on the other hand, leverage the affordability of a $75 annual membership that costs less than a month of CTA passes, and have started incorporating Divvy into their commutes.
- Divvy day-pass users tend to be “fair weather bikers”
John Savage – a research assistant at the University of Chicago and finalist for the “Most Insightful” category – found that weather and ridership were correlated, charting how the number of trips taken is proportionate with the average daily temperature. This may come as little surprise, considering that relatively few bikers are willing to brave Chicago’s bone-chilling winters. However, Savage also found a strong correlation between cloud cover and number of trips taken in 2014, especially for day-pass users.
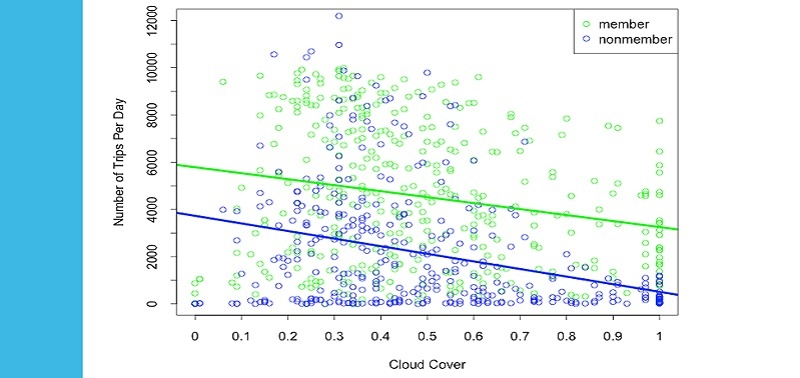 If the cloud cover is above 75 percent, there were never more than 2,000 non-members trips, while there were up to 12,000 non-member trips on clearer days. Members tend to be more consistent riders, and take short trips in all weather. Day-pass users tend to be “fair weather bikers” and extend their trip length on sunny days. As the weather cools down, however, their ridership drops significantly. On the rides they do take, their trips get much shorter.
- Divvying can be faster than some forms of public transit
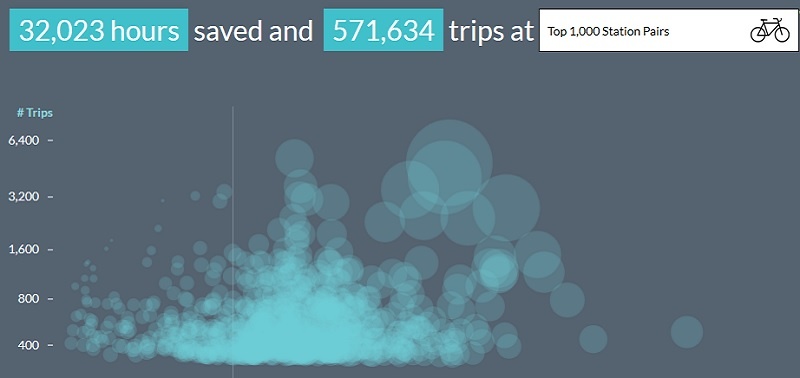
How does a three-speed, 45-pound Divvy bike measure up against the CTA in a station-to-station race? You might be surprised, but Divvying is often faster. For his visualization, Shaun Jacobsen – Transitized blogger and one of the finalists in the “Best Overall” category – looked at the top 1,000 station pairs (or the places Divvy riders travel between most often). He took a sample from peak usage time – Monday at noon – and found that, on average, Divvy riders saved five minutes compared to their counterparts on the CTA. Although five minutes doesn’t seem like much, over the year it added up: Jacobsen recorded 32,023 hours saved on 571,634 Divvy trips versus public transportation.
Jacobsen’s project seems to support the idea that bikesharing is transit, and can be an effective and efficient way to travel, especially for short connector trips in a city’s urban core. Recent research by the University of California, Berkeley also suggests that, in larger, denser cities like Washington, D.C., bikesharing can act as an alternative for short rail trips to help alleviate pressure on transit demand in core service areas. Bikeshare and other forms of shared mobility can also help to expand and establish new connections within public transit networks – especially in more dispersed communities and small to mid-sized cities without dense urban cores.
 It’s also important to note that biking doesn’t work for every person in every occasion – due to issues such as health, limited mobility or inclement weather – so traditional fixed route transit is still a vital part of any city’s transportation portfolio. With more options and more flexible transportation modes at their disposal, however, riders may opt to use public transportation more frequently and further embrace “car-lite” living.
Overall, if there’s one that’s clear, it’s that three speeds aren’t slowing Chicagoans down – proving that Divvy, Chicago’s “newest transit system,” is here to stay.
The Divvy Data Challenge was created in partnership with Microsoft and RedEye Chicago. To see all the finalists’ visualizations, visit https://www.divvybikes.com/datachallenge. For more information on Divvy, visit https://www.divvybikes.com.