2020 was a difficult year for mobility services. As a result of concerns over COVID-19, public transit use declined across the country even as it continued to serve as an essential service. At the same time, transit agencies and mobility operators stepped up to fill important needs for the most vulnerable populations. Several transit agencies pivoted to provide food and package deliveries as well as free shared mobility services for essential workers during the early stages of the pandemic. As many Americans shifted to working from home, they also increasingly turned to active mobility options including walking, bicycling, and e-scooters. Pop-up bike and pedestrian infrastructure was deployed in cities across the country as people still needed to find ways to relax and travel for their daily needs and work.
Twice a year, SUMC updates the data on its Metro Profiles to reflect changes in shared mobility across the nation’s 25 most populated metropolitan areas. Collecting this data involves a combination of reviewing articles, press releases, operator-shared data, operator websites, and API data. The data were collected between September through October 2020. Scooter share data were added to this latest update to complement the already collected bikeshare and carshare data. Below are some of the highlights we learned from cities across the country. Visit the Learning Center Metro Profiles to explore the shared mobility options available in communities across the US.
Scooter Share Highlights
 Shared e-scooter service continued to expand from 2019 to 2020, with scooter share operating (or near term plans to start operation) in 20 of the 25 most populated metropolitan areas. Within these regions, multiple operators often provided service, in one case as many as 10. New business models were also introduced, like the remotely operated e-scooters from Tortoise, which launched a small fleet in Atlanta during the summer. These devices can be delivered to their users and returned to docking stations by remote operators. The hope behind this technology is that the e-scooters can be repositioned and balanced more easily to help alleviate e-scooter clutter in the public right-of-way and reduce the impacts of rebalancing using trucks or vans.
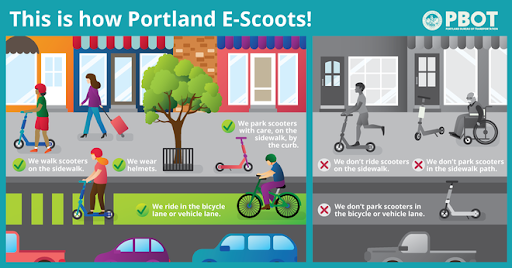
SUMC also observed efforts to declutter sidewalks and protect the public right-of-way in other markets in 2020. Seattle’s efforts to build additional parking and micromobility infrastructure, along with its collaboration with Rooted in Rights, a disability advocacy group that worked with Seattle Department of Transportation (SDOT) to produce an informational video series on e-scooter and bicycle best practices, were further realized in 2020. (SDOT and Rooted in Rights spoke about Seattle’s micromobility planning efforts at the SUMC 2020 National Shared Mobility Summit).
The table below presents available data on e-scooter deployments and fleet caps (the maximum legal number of vehicles permitted in a jurisdiction, regardless of how many are actually deployed). Notable among the data are the range of fleet caps from 67,500 in Los Angeles to 1,000 in the Baltimore metropolitan areas. These figures help support the idea that in order for scooters to be relied upon as a mode of travel they need to be available widely enough to fully cover a market. The fleet cap is also presented as a rate per 10,000 metropolitan residents to standardize the data so that the availability of e-scooters can be compared across metropolitan areas.
Top 5 Scooter Share Market Operators when looking only at the top 25 most populated metro areas:
- Bird – serves 16 metros and 31 markets
- Lime – serves 16 metros and 30 markets
- Spin-Ford – serves 15 metros and 21 markets
- Razor – serves 9 metros and 13 markets
- Lyft – serves 7 metros and 9 markets
Top 25 Populated Metropolitan Areas: Scooter Share Availability
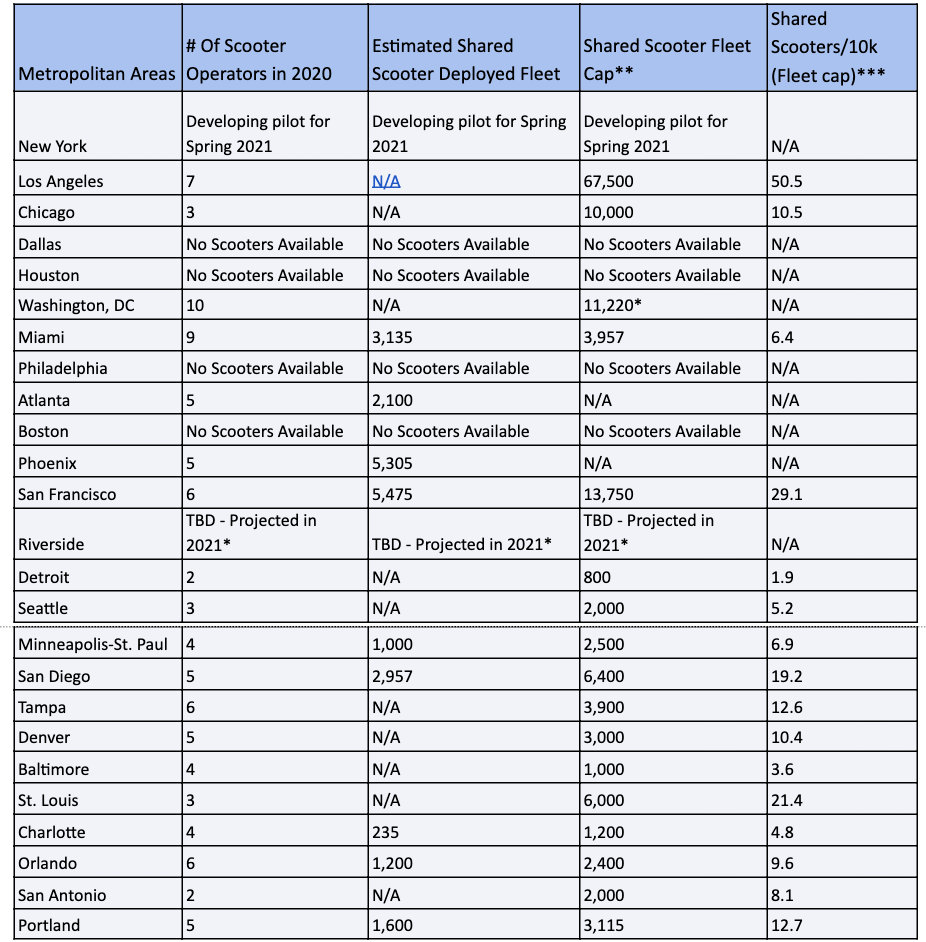
Due to data availability limitations, the list of shared mobility operators and service levels does not necessarily represent every shared mobility operator in a region. This mobility data should be read as indicative of magnitude rather than exact service levels or vehicle counts.
*Washington D.C Metro Area will have an additional e-scooter market for Arlington, VA in 2021.
** The fleet cap represents the total across all operators in a given market.
***The per capita e-scooter figures are based on the fleet cap due to fluctuations in daily deployment figures in a given metro.
Other scooter share highlights noted from our analysis include:
- VeoRide and Wheels were only in one metro area in 2019 (Chicago). By December 2020, VeoRide expanded to 3 metros (Tampa, San Francisco, and Atlanta) and Wheels expanded to 6 (San Diego, Seattle, Phoenix, Orlando, Miami and Los Angeles)
- New e-scooter providers in 2020 include:
- There were also several COVID-19 scooter share related closures:
- Lime e-scooters temporarily suspended their e-scooter fleets in several U.S markets due to health concerns (Dallas Metro area, Detroit Metro area, Alexandria/Washington Metro area).
- Bird e-scooters temporarily suspended their e-scooter fleets in several U.S markets due to health concerns (San Francisco Metro area, Miami Metro area, Dallas Metro Area).
Bikeshare Highlights
 Bikeshare continued to gain popularity in 2020. Despite closures and suspensions related to COVID-19, and companies like Zagster ceasing U.S. operations, our scan of the top 25 most populated metropolitan areas indicates that the bikeshare fleet size grew over 18% from 2019 to 2020. Notable increases to fleet sizes came from Divvy/Lyft Bikes in Chicago and Lyft-operated BayWheels in the San Francisco metropolitan area.
Micromobility and equity of services continued to be at the forefront of a number of e-scooter and bikeshare programs in 2020. In Chicago, for example, e-scooter operators were required to locate at least 50% of their fleet within Equity Priority Areas, which covers 43% of the total pilot area. The city of Chicago indicates that it will check for compliance for this requirement twice per day. The Equity Priority Areas were chosen in these communities due to the disadvantages that area residents face with underdeveloped transportation and urban development resources. Additionally, each operator is required to provide access to their system without a smartphone as well as offer cash-based payment options for unbanked users.
One of the biggest trends SUMC observed is the proliferation of e-bikes and their adoption rates across the top 25 metropolitan areas, with 20 of them adding e-bikes to their existing e-bike fleet or adding them as a new mobility option all together. Nearly 70,000 bikeshare bikes are either in operation or poised for launch in the near future. The table below shows the 25 metros reviewed in this analysis and the operators who manage e-bikes, the estimated bikeshare fleet size, the estimated percent e-bikes, and the total bikeshare fleet per 10,000 metro residents.
Bikeshare’s Top 5 Fleet Size Operators when looking only at the top 25 most populated metro areas:
- Lyft – has an estimated fleet size of 54,940 across 9 metros and 24 markets
- B-Cycle – has an estimated fleet size of 6,180 across 10 metros and 17 markets
- CycleHop (HOPR) – has an estimated fleet size of 2,885 across 6 metros and 13 markets
- Lime – has an estimated fleet size of 2,635 across 4 metros and 6 markets
- Indego – has an estimated fleet size of 1,550 across the Philadelphia Metro Area
Top 25 Populated Metropolitan Areas: Bikeshare Availability
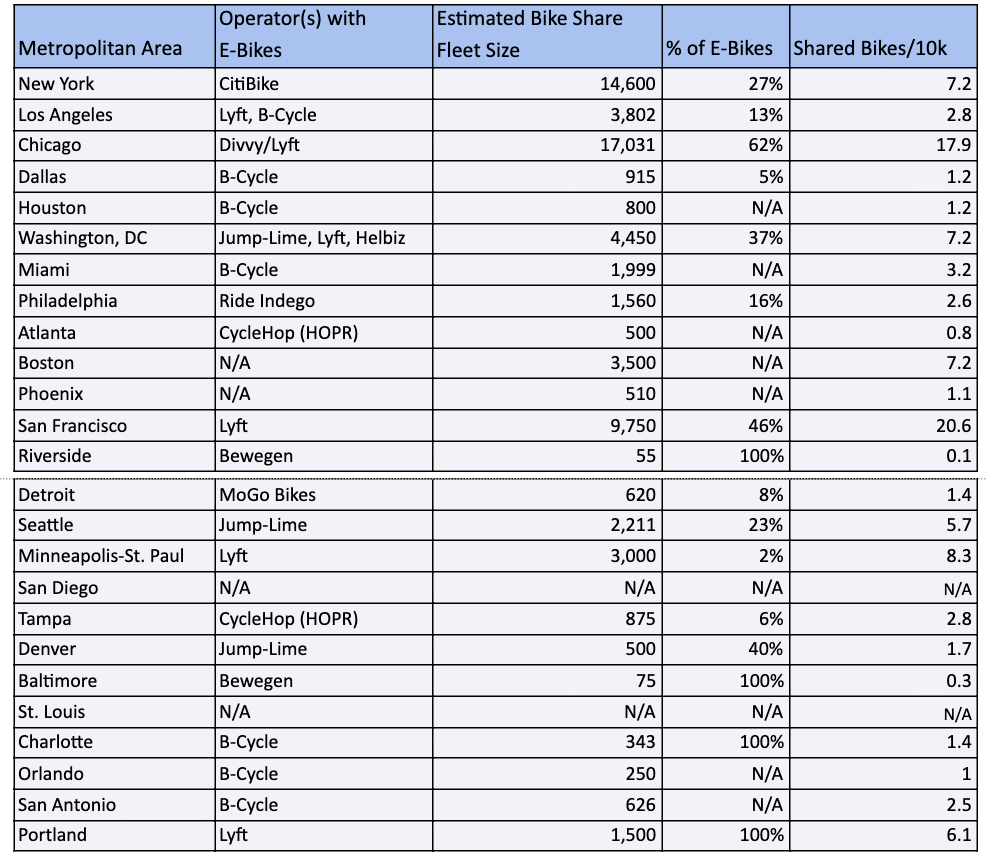
Due to data availability limitations, the list of shared mobility operators and service levels does not necessarily represent every shared mobility operator in a region. This mobility data should be read as indicative of magnitude rather than exact service levels or vehicle counts.
While the growth in bikeshare and in particular e-bikes is impressive, 2020 experienced a number of scaled down systems and closures, mostly related to COVID-19 restrictions.
- Zagster – The bikeshare company Zagster announced in March that it would suspend all operations in the U.S due to the pandemic. In June the company announced it will terminate nearly all bikeshare operations across the country.
- Lime/Jump – With Lime’s acquisition of Jump bikes from Uber in May, Lime operates all Jump bikes across the country. As of May Lime/Jump has pulled out of some cities in California, Miami, Texas, and Maryland due to COVID-19 restrictions.
- In some cases, when bikeshare operators re-entered a market they did so with smaller fleets due to COVID-19 restrictions from local and state governments. Examples include Baltimore, Seattle, Denver, and Washington, DC
Carshare Highlights
 Despite reductions in carshare in 2020, both in terms of operators and markets served, carshare continues to be a steady mode and option of travel. Zipcar offers service in all of the top 25 metropolitan areas. And, while Car2Go closed its operations across North America, those closures were partially offset by AAA GIG carshare expanding its operations to Seattle, along with other investments in carshare. Among those investments includes an IAC investment of $250 million in Turo (formerly known as RelayRides). Turo operates under a peer-to-peer mode similar to Airbnb’s, allowing drivers to rent personally owned cars across the US, Canada and the UK. The car owners, or “hosts,” go through a screening process to become eligible to place vehicles on Turo’s platform, where they can then earn money to offset the cost of car ownership. Turo will also be operating in all 25 metropolitan areas in this analysis with the planned launch of services in New York City in January 2021.
While the carshare industry has continued a longer-term trend of contraction and consolidation in general it remains a steady mode. However, it too experienced COVID-19 related closures and suspension of service. Enterprise indefinitely suspended operations in Honolulu, New York, Philadelphia, St. Louis, along with several other cities in the summer, and Maven, which was one of the more promising niches to emerge to help make ridehail/gig driving a little better terminated its remaining carshare operations across the U.S.
Presented below are the estimated carshare fleets and shared cars available per 10,000 people.
Top 25 Populated Metropolitan Areas: Carshare Availability
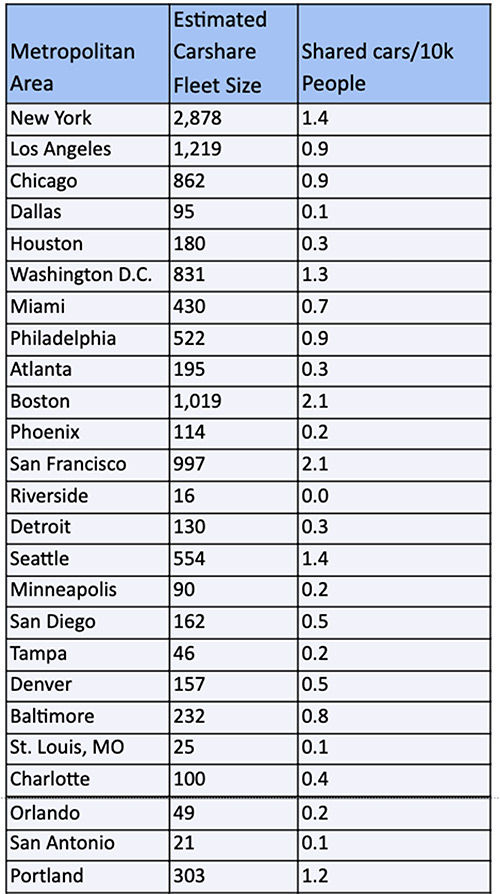
Due to data availability limitations, the list of shared mobility operators and service levels does not necessarily represent every shared mobility operator in a region. This mobility data should be read as indicative of magnitude rather than exact service levels or vehicle counts.
Looking Ahead
While 2020 was an unprecedented year for every sector, the transportation sector in large US metro areas was particularly affected. Among the mobility modes hit hardest is public transit with ridership rising and falling throughout the pandemic in response to COVID-19 health alerts. Many of the impacts will be felt in shared mobility beyond 2021. The radical shift in work trips, with essential and shift workers still traveling as before, and office workers telecommuting will complicate public transits recovery. We will keep observing whether this remains the case after widespread vaccination and wider comfort with traveling. We will also keep an eye on ongoing developments in Mobility as a Service, as the private mobility companies continue to incorporate transit trip planning and payment into their apps, electric vehicle adoption particularly in regard to shared fleets, and the growth of shared autonomous vehicles. A profile is by nature temporary as the influencing factors (society, government, health, economy, innovation) change around it, so these Metro Profiles will be updated again to track our urban environments.
By: Al Benedict, Director Learning Center and Accessibility Programs, Shared-Use Mobility Center and Jacob Walls, Research Associate, Chaddick Institute for Metropolitan Development, DePaul University.
If you have any questions, you can email Al Benedict at albert@sharedusemobilitycenter.org.