Wouldn’t it be great if you could quickly create a report showing all the shared mobility infrastructure in a specific neighborhood? And what if you could add other data layers, too, such as average housing costs, job density and vehicle ownership rates?
Good news – you can do all the above and more using the new “Market Report” feature in SUMC’s interactive Shared Mobility Mapping Tool.
The report is one of several new upgrades to our Shared Mobility Toolkit (we also recently partnered with ITS America and the Federal Transit Administration to add information on over 60 public-private partnerships to the Mapping Tool and Policy Database).
SUMC’s new Market Report feature was built to help users—including transit agencies, planners, advocates, developers, TDM professionals and more—assess the potential for establishing or expanding shared mobility in specific neighborhoods, including those where transportation options are lacking.
The Market Report feature allows users to:
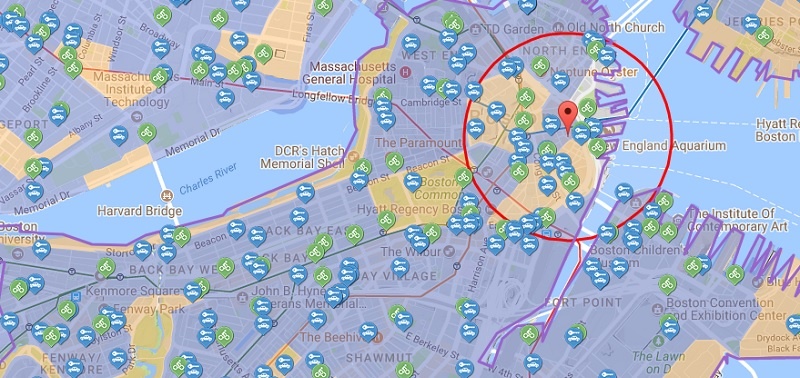
- Zoom in past the city level to explore characteristics on a neighborhood basis. Users can select a community by using the circle tool (approximately 0.5 miles in diameter) or by drawing a polygon to select a custom area.
- View a “shared mobility opportunity score” for each targeted area, in addition to robust data on housing costs, commute mode, vehicle miles traveled (VMT), jobs by sector, job density, ethnicity, educational attainment, vehicle ownership and more.
- Save and recall reports and export them as PDFs for easy printing and sharing. The Mapping Tool also allows users to save geographic boundaries for future reference.
You can create your own market report for any neighborhood in the Mapping Tool’s available cities by following six simple steps.
How to Create a Shared Mobility Market Report
- Visit the mapping site and select a city. You can pick a city from the drop down list under the “Choose a City or Region” item on the menu bar, or by simply clicking on the map.
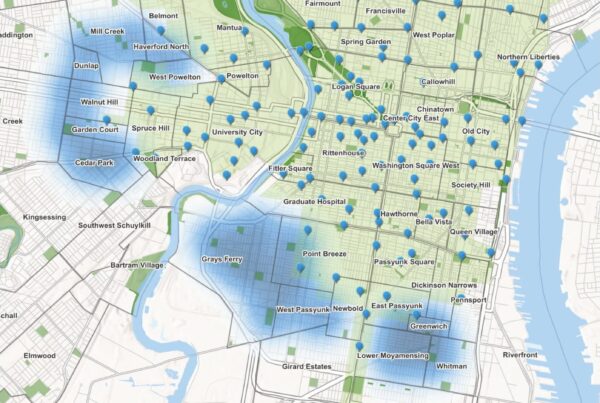
- Choose map data options. You can determine which data you would like to appear on the base map using the “Choose a Map Theme” dropdown menu (the default map theme is “Shared Mobility Opportunity Analysis”). Other data themes include household and job density, race, and income. Every detailed view also includes city and regional profiles along with shared mobility and transit data layers, which can be turned on or off.
- Select an area for the Market Report. Create a circle or polygon boundary for the area of interest. A half-mile circle will initially be displayed at the center of the current map view and can then be dragged to the area of interest. Zooming in will show more local detail to help identify an exact location. The various map themes can be displayed, or you can select “None” for a cleaner view.
- View the Market Report. Once the boundary is drawn, a detailed market report is generated automatically at the bottom of your screen and organized by data category. Click through the green market report tabs to access the different data categories for the selected area.
- Download your Market Report. You can download a report that contains formatted maps of the layers and all the market report variables. Simply click “Download” to save the report to your computer.
- Save a Market Report boundary. You can also save the geographic selection to quickly reference it in the future. When saving a report, click “OK.” Do not select “Prevent this page from creating additional dialogs.” If selected, this option will disable the Market Report tool.
Once saved, you can continue to view the report variables or click “Cancel & Start Over” to clear the selection and start a new boundary. To create a new report, draw another circle or polygon around a new target area. To access a previous report, click on “Previous Report.”
A step-by-step illustrated guide on generating market reports using SUMC’s Shared Mobility Mapping Tool is also available here.
To keep up to date on upgrades to SUMC’s Shared Mobility Toolkit and other new developments, be sure to sign up for SUMC’s newsletter. If you have questions about the mapping site or other tools, please contact us.