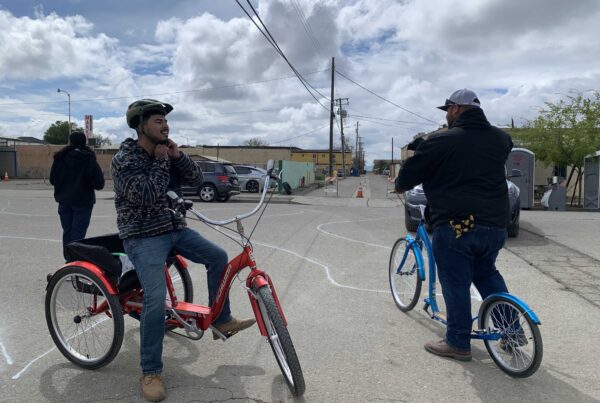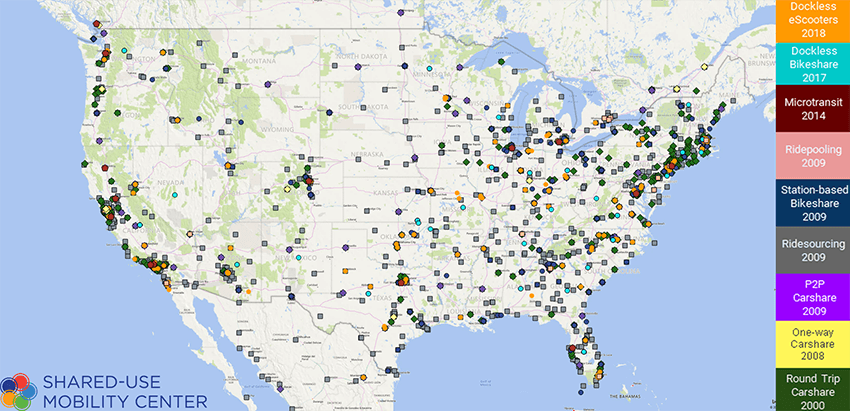
Growth of Shared Mobility Services from 2000-2018
Whether they are locating vehicles, visualizing demographics, or plotting data, maps uniquely show us how information correlates and where we might need to go next. When your destination is a multimodal transportation system for all that is connected, affordable, and sustainable, a clear view of the current landscape is crucial. This special edition of the Mobility Hub features the latest maps in the most relevant categories. We will return to our standard format next week. Happy map reading!
Mobility on Demand Learning Center
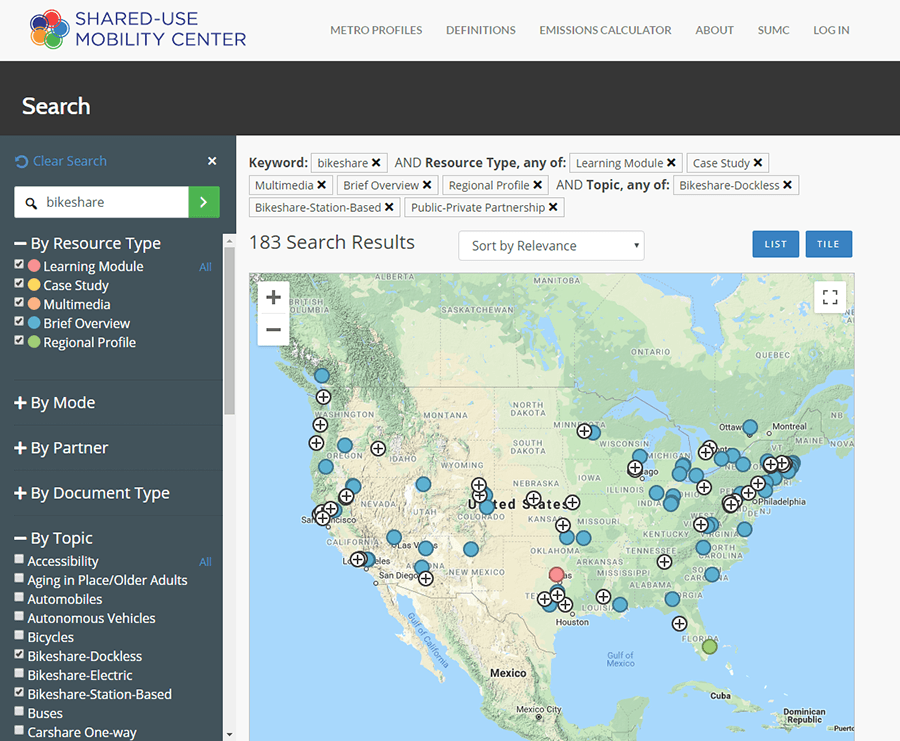
Did you know you can search by map for shared mobility case studies, briefs, regional profiles, and more on the MOD Learning Center? On the home page, click ‘Search by Map’ on the right, then choose from resource type, mode, partner, document type, or topic for comprehensive drop-down options.
Micromobility
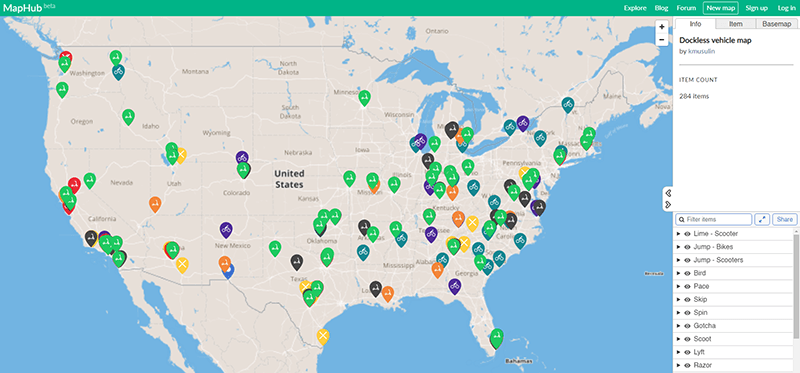
Dockless mobility is constantly changing. Thankfully, so is Smart Cities Dives’ interactive map of the state of dockless mobility in the US. New this week: Spin launched scooters in Boise, ID, Lyft received approval to launch scooters in Indianapolis, and Scooters returned to Portland, OR and St. Paul, MN.
More micromobility maps:
- If you want a more data-driven version of a scooter map, a former LA DOT analyst mapped every dockless vehicle in LA based on publicly-available GBFS feeds.
- A new map app, simply called Scooter Map, shows all of the dockless scooters in your area, including Bird, Lime, Spin, Jump, Lyft, and more.
- Want to know of all the low-stress bike streets and routes while experiencing a vibrant cycling community in Denver? Then Bike Streets Project might be up your ally.
Transit Maps and History
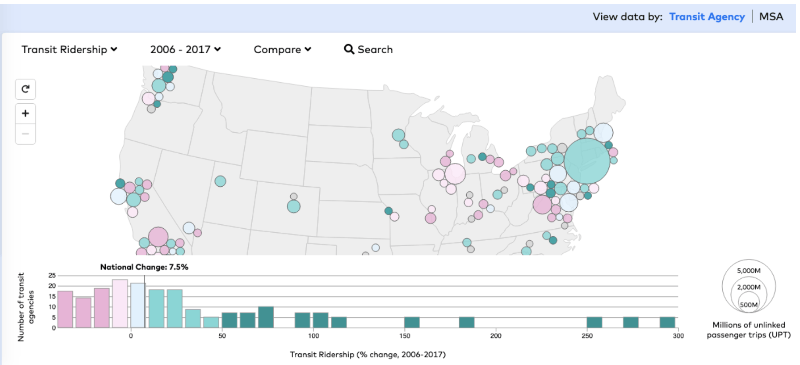
Transit Insights is a new mapping tool by TransitCenter that combines data from the National Transit Database, the US Census, and route maps from Transitland to compare transit systems in the US on factors like regional population changes, population density, fare prices, operating costs system coverage over years of data.
More transit maps:
- “Mapping the Human Factors Behind Transit in Santiago, Chile”. Mapping platform CARTO highlights transportation engineer Ariel López’ work on mapping over 18 million urban transit trips of public, private, and non-motorized modes in Santiago, Chile.
- Check out this San Francisco Streetcar Guide that teaches you streetcar history while searching for your ride.
Accessibility and Sustainable Growth Tools
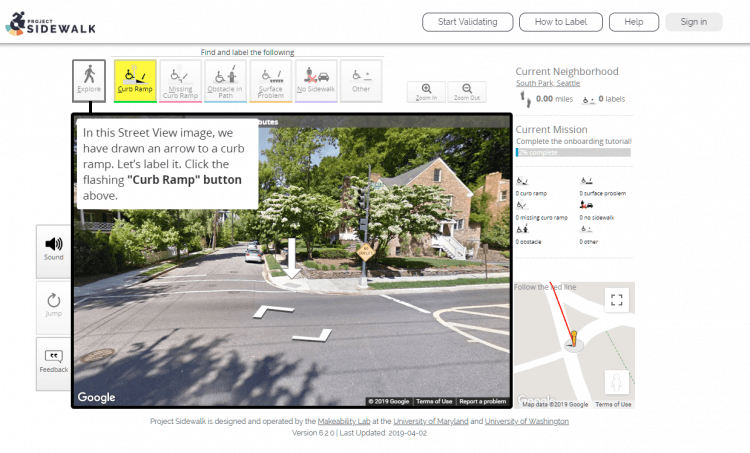
First launched for DC then Newberg, OR, Project Sidewalk is an online, crowdsourced tool helping people with disabilities and mobility impairments by collecting “street-level data about accessibility in cities.”
More accessibility and sustainable growth tools:
- London-based startup Scape uses its visual positioning service with GPS and augmented reality to collect “over two billion street images to precisely 3D-map more than 100 cities around the world, including London, San Francisco, Paris, Moscow, and Tokyo.”
- UC Berkeley has created a new interactive mapping tool that shows the neighborhoods in LA and San Francisco that would be most impacted by California’s proposed Senate Bill 50 aiming for higher housing density around transit stations.
- This map visualizes what the climate will feel like in 60 years, comparing US cities to other current regions’ seasonal weather, even factoring if carbon emissions were reduced.
Equity and Equal Opportunity
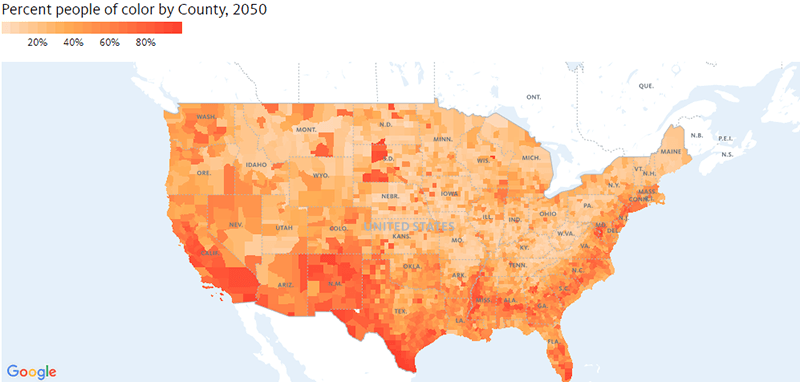
Even four years after its initial launch, PolicyLink and the University of Southern California’s Program for Environmental and Regional Equity (PERE) might still have one of the best and most comprehensive graphics for economic equality available today: The National Equity Atlas.
More equity and equal opportunity maps:
- Check out this interactive map that helps teachers find affordable housing in California.
- insideBIGDATA looks at the tools and visualization resources that can help analyze disparities in social equity in different regions and communities to better understand the issues facing disadvantaged groups.
Did someone forward this to you? You can sign up for our newsletter here.